3. Read the whole-system timeline
Nsight Systems answers when work occurs and what was waiting. It does not explain the instruction-level reason a kernel is slow.
Nsight Systems does not run your program instruction-by-instruction. It attaches to the CUDA driver and runtime through CUPTI (the CUDA Profiling Tools Interface) callbacks that fire whenever your program calls into CUDA — kernel launches, memory copies, stream and event operations — timestamping each one, while separately sampling OS-level thread and call-stack state (via OS scheduler and backtrace sampling) to see what the CPU is doing between those calls. It then merges both streams — the timestamped CUDA API/activity records and the sampled CPU state — into the single timeline you read in the viewer. This is why its overhead is comparatively low: it is mostly recording API calls that already happen and periodically sampling, not injecting deep instrumentation into every instruction. That low, roughly constant overhead is also why it is safe to run broadly and first, unlike Nsight Compute, whose kernel replay is invasive enough that it must be pointed at a small, already-identified target.
Instrument application semantics with NVTX
Ranges should describe coarse work: iteration, data load, forward, loss, backward, optimizer, communication, and checkpoint. Avoid marking every tiny operation.
#include <nvtx3/nvToolsExt.h>

nvtxRangePushA("iteration");
nvtxRangePushA("forward");
forward();
nvtxRangePop();
nvtxRangePushA("backward");
backward();
nvtxRangePop();
nvtxRangePop();
For Python frameworks, use their NVTX range context or direct NVTX bindings. Warm up outside the capture range.
An NVTX push/pop call just stamps a named, timestamped marker into the
CPU-side record for the profiler to display as a labeled row — it performs no
GPU work and adds negligible CPU cost, unlike the tracing and counter
collection nsys itself does on the CUDA API and kernel activity. That
asymmetry is why NVTX ranges are cheap enough to leave in near-production
code even when broader profiling is not running.
Start with a bounded trace
Open with a single, broad capture before narrowing to any specific concern:
nsys profile \
  --trace=cuda,nvtx,osrt \
  --sample=process-tree \
  --cpuctxsw=process-tree \
  --cuda-graph-trace=node \
  --output=timeline \
  ./application --profile-steps 5
A CUDA Graph captures a sequence of GPU operations and their dependencies once, then replays that whole sequence with a single launch call, amortizing host dispatch overhead across every node in the graph — this replay mechanism is the evidence behind Case A in the case studies (ch. 13). Node-level CUDA Graph tracing is useful when the graph's internal kernel mix is the subject of analysis, but it produces more data and overhead than graph-level tracing. Capture only enough steady-state iterations to see repetition.
Read the timeline top-down
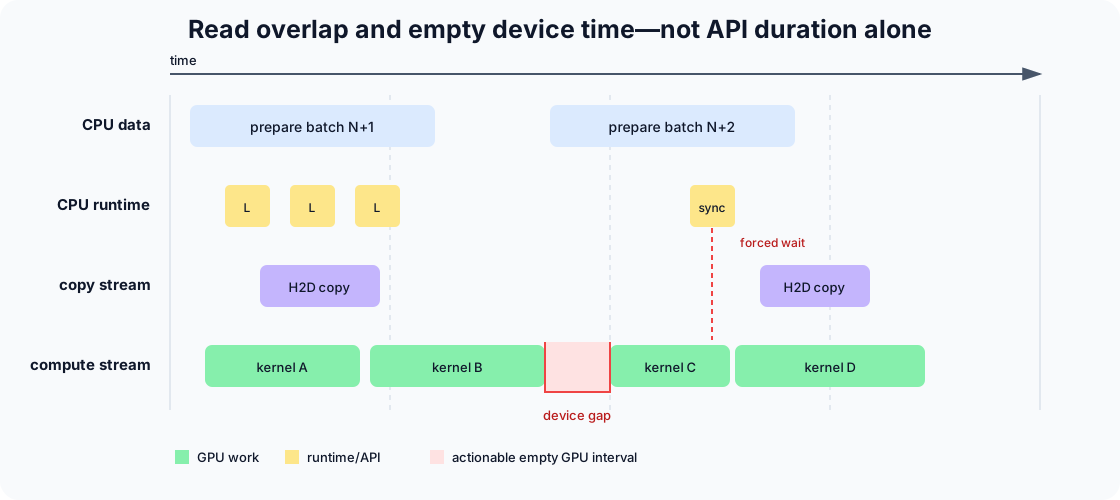
Ask these questions in order:
- Are there GPU-idle gaps inside the steady-state range?
- Is a CPU thread runnable, descheduled, blocked in a CUDA API, or doing data work during each gap?
- Are copies serialized with compute or placed on independent streams?
- Are allocations, page faults,
.item()-like scalar reads, or device-wide synchronizations present? - Is work balanced across streams/devices?
- Does the pattern repeat, or is it a one-time initialization event?
Interpret CUDA API time carefully
A long cudaGraphLaunch, cudaMemcpyAsync, or kernel-launch API call does not
automatically mean the API itself consumed that time as overhead. The call can
block under driver queue backpressure while previously submitted GPU work is
running. Confirm a host bottleneck with device-idle gaps and the corresponding
CPU state. Match the observed combination against a short set of recurring
patterns:
| Timeline pattern | Likely interpretation | Next check |
|---|---|---|
| GPU gaps; CPU executing framework code | dispatch/input bottleneck | CPU samples, Python backtraces, graphs/compile |
| GPU gaps; CPU blocked on sync API | accidental dependency | API backtrace, scalar reads, allocator |
| continuous kernels; CPU blocked in launch | queue backpressure, not starvation | device utilization and gaps |
| large H2D/D2H bands | explicit transfer or migration | bytes, direction, pinned memory, overlap |
| no copy bands but high DRAM traffic | kernels streaming data | Nsight Compute memory sections |
CLI summaries
Turn the same capture into ranked numbers instead of scrolling the timeline:
nsys stats --report cuda_gpu_kern_sum,cuda_gpu_mem_time_sum timeline.nsys-rep
nsys stats --report cuda_api_sum,nvtx_sum timeline.nsys-rep
Use summaries to rank kernel families, but return to the timeline for causality. Summed kernel durations can exceed wall time when streams overlap.