6. A disciplined Nsight Compute workflow
Nsight Compute explains one selected kernel using launch metadata, static analysis, hardware counters, and PC sampling — periodically recording which instruction (program counter) each active warp was on and why it wasn't issuing that cycle, building a statistical map of where a kernel's time and stalls concentrate without recording every single cycle.
To build that picture, Nsight Compute pauses execution at one selected kernel
launch and reads hardware performance counters: physical counter circuits
built into each SM and into the memory subsystem that increment whenever a
specific hardware event occurs — an instruction issued on a given pipe, a
cache miss, a cycle a scheduler spent with no eligible warp of a particular
stall type. Each SM has only a limited number of these physical counters, and
many metrics either compete for the same counter hardware or are otherwise
mutually exclusive to collect in a single pass. Replay exists to work around
that limit; it is not just an implementation detail of "how ncu reruns a
kernel," it is the reason multiple passes exist at all. A --set full report
can be dozens of real kernel executions stitched together, each pass
collecting a different subset of counters, with device memory saved and
restored between passes so every pass sees the same input state and produces
counter values that are comparable with one another. This is also the root
cause of a fact the next section states directly: raw ncu duration does not
match the nsys timeline duration, because the kernel being timed in an ncu
report executed multiple times, in isolation, under replay control — not once,
in its original place alongside everything else on the timeline.
Capture in layers
Start cheap and escalate only as needed:
# Static launch data plus a small counter set
ncu --set basic \
    --kernel-name-base function \
    --kernel-name 'regex:my_kernel' \
    --launch-count 1 \
    -o my_kernel_basic \
    ./application

# Broader diagnosis
ncu --set detailed --kernel-name 'regex:my_kernel' --launch-count 1 \
    -o my_kernel_detailed ./application

# Expensive, multi-pass evidence after the launch is known to be stable
ncu --set full --kernel-name 'regex:my_kernel' --launch-count 1 \
    -o my_kernel_full ./application
Use --launch-skip N to reach a later matching occurrence. Filters count
matching launches, whereas --launch-skip-before-match counts all launches.
Inspect ncu --help for the exact NVTX range syntax supported by the installed
version.
Replay changes execution
Many metrics cannot be collected simultaneously. Kernel replay restores memory and runs the selected kernel in multiple passes. Consequences include:
- raw duration may not match the
nsystimeline; - cache and residency state may change;
- nondeterministic or stateful kernels may need application replay (reruns the whole program) or range replay (reruns only a marked range) instead, when kernel replay's memory restore is not safe;
- host memory backup can be expensive for kernels touching large allocations;
- uncontrolled clocks can differ between reports.
Use the Systems duration for contribution and the Compute report for the kernel's performance character. If raw timing is important, use a dedicated benchmark with stable clocks and minimal counter collection.
Read sections in a fixed order
Once a report is captured, the biggest risk is reading it out of order — jumping straight to the most dramatic number instead of building up resource and issue context first.
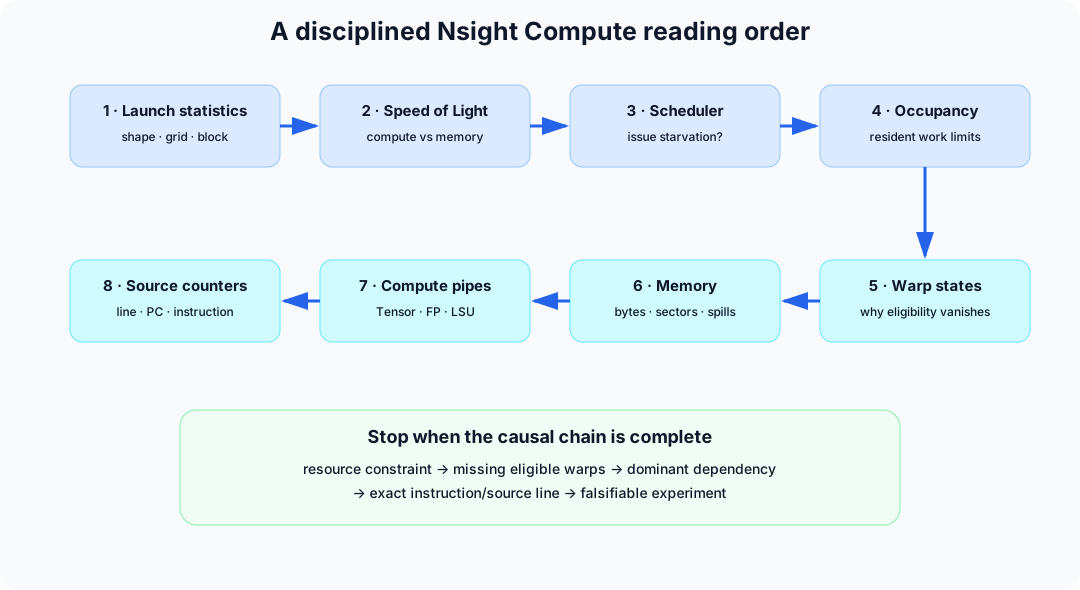
Do not begin with stall percentages. NVIDIA's own guidance is to focus on stalls when schedulers fail to issue; a busy scheduler can accumulate benign stall samples among warps it did not choose.
The four-way first classification
With reading order fixed, use memory and compute pressure together for a first-pass classification:
| Observation | Working classification | Confirm with |
|---|---|---|
| high DRAM/L2, low compute | bandwidth or memory-latency limited | bytes, hit rates, sectors, scoreboard |
| high Tensor/FP pipe | compute-pipe limited | math throttle, instruction mix |
| both high | well balanced near roof | roofline, end-to-end share |
| both low | latency, dependencies, insufficient parallelism, tails | eligible warps, waves, occupancy, stalls |
“High” is architectural and workload dependent. Use achieved percentage of the relevant peak, not a universal 80% rule.
Eligible warps and stalls (ch. 8), occupancy (ch. 7), and wave/tail efficiency (ch. 10) each get their own chapter. Treat this table as the dispatcher that tells you which of those chapters to open next, not as a definition of the terms themselves.
Export reports reproducibly
Once a report supports a working classification, preserve it rather than re-deriving it from a narrow export:
ncu --import my_kernel_full.ncu-rep --page details --csv
Keep the binary .ncu-rep; the UI includes rooflines, source correlation, and
occupancy what-if controls that a narrow CSV export cannot reproduce.