11. Source, PTX, and SASS correlation
Counters locate the limiting resource. Source and SASS identify the instruction responsible for it.
nvcc compiles CUDA C++ in stages rather than going straight to hardware
instructions. It first compiles to PTX, a portable virtual instruction set
that stays stable across GPU generations — conceptually similar to a portable
assembly language, but not the code the hardware directly executes. From
there, either at build time via ptxas or lazily at runtime by the CUDA
driver's own JIT compiler, PTX is lowered to SASS: the GPU's native,
architecture-specific machine instructions, the final compiled form actually
run by the hardware. Register allocation, instruction scheduling, and the
choice of which hardware instruction to emit — such as whether an MMA
instruction was actually generated for a given operation — are all decided
during this lowering step, not before it. PTX is one compilation stage
removed from what the hardware runs.
Build for correlation
For optimized profiling builds, prefer line information without full debug code generation:
nvcc -O3 -lineinfo -Xptxas=-v kernel.cu -o kernel
-G changes optimization and resource use substantially; reserve it for
correctness debugging. Keep generated cubins/cache files for JIT systems when
possible.
The lowering path
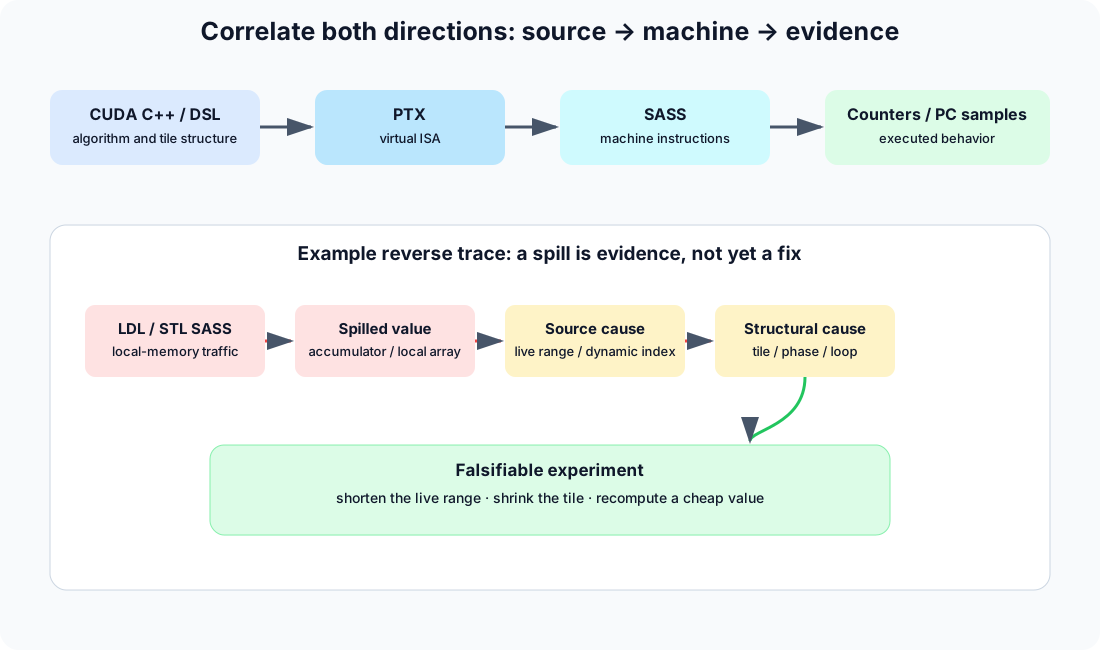
PTX is not the final instruction stream. Register allocation, instruction scheduling, memory operations, and Tensor instructions must be confirmed in SASS or Nsight Compute's Source page.
Command-line inspection
Confirm the lowering path directly, without the UI, when a quick check or a scripted comparison is enough:
cuobjdump --dump-resource-usage ./application
cuobjdump --dump-sass ./application
nvdisasm --print-line-info kernel.cubin
In Nsight Compute, correlate hot PCs and sampled stalls with both source and SASS. Look for:
- local loads/stores near long-scoreboard samples;
- repeated address arithmetic feeding LSU pressure;
- shared-memory operations with conflict wavefronts;
- missing or sparse MMA instructions;
- barriers and waits in a tight loop;
- type conversions or FP32 instructions in an intended low-precision path.
Source attribution can be incomplete
Header-only libraries, JIT kernels, stripped cubins, link-time code, and code generated without line info may show only SASS. The diagnosis is still possible: use instruction addresses, register dependency chains, opcode class, and memory spaces. Do not rebuild with radically different optimization flags and assume the new kernel represents production.
From sample to edit
Suppose long-scoreboard samples land on a local load. Trace backward:
- Locate the hot PC/source line on Nsight Compute's Source page.
- Confirm the instruction addresses local, not global, memory — check the memory space in the disassembly or the local-traffic counters, not just the opcode.
- Identify the register or variable whose live range or dynamic indexing forces the spill (see the register-spill diagnosis in ch. 7).
- Trace that variable to the source-level construct responsible: a large per-thread array, a live range spanning a loop, dynamic indexing into a local array, or excessive live temporaries.
- Form the one-variable experiment: change that single tile or live-range parameter and nothing else.
After editing, require the full chain to improve: fewer local sectors, more eligible warps or shorter dependency stalls, lower representative launch time, and lower end-to-end time.