4. Attribute time to application passes
The system trace tells you whether the GPU is fed. Pass attribution tells you which semantic phase owns the work.
Use nested ranges and CUDA events
A training iteration might be segmented as:
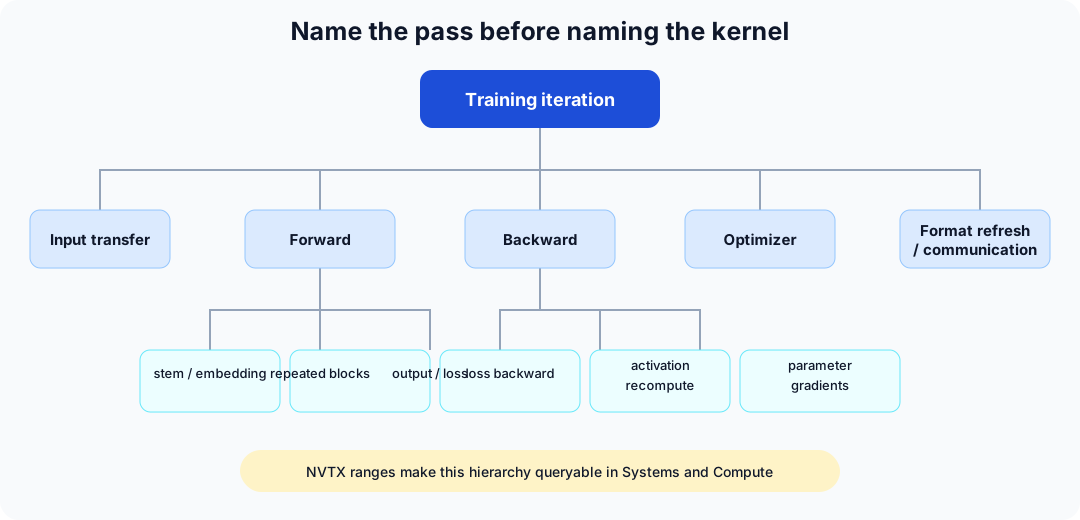
Put CUDA events at boundaries on the same stream for device elapsed time. Also measure host wall time around enqueueing. Never infer GPU pass time from Python function duration without an explicit synchronization or event. Operations enqueued on one stream execute in submission order, so an event timestamp reflects true completion order relative to the surrounding work on that stream, which is why same-stream events give trustworthy elapsed device time. Python-side wall time around a call is unreliable for the same reason it is unreliable elsewhere in this book: the call is asynchronous, so the host thread returns immediately after enqueueing, and unsynced wall time around it measures dispatch latency, not execution time.
Checkpointing changes the meaning of “backward”
With activation checkpointing, backward contains recomputed forward kernels. Categorizing only by kernel name can therefore overstate the original forward and hide recompute tax. NVTX ranges emitted by the autograd engine or explicitly timed pass boundaries preserve the causal phase.
For total forward time , backward work , and recomputed fraction , a rough iteration model is
Measure rather than assume ; custom recurrence, reductions, quantization, and fused loss kernels break simple FLOP models.
Kernel-family bucketing
Normalize long templated kernel names into meaningful families. Preserve enough metadata to distinguish materially different shapes.
| Raw launch property | Useful normalized field |
|---|---|
| demangled name | family: GEMM, norm, reduction, attention, quantize |
| grid/block | problem/tile class |
| registers and shared memory | resource signature |
| enclosing NVTX range | application pass |
| launch count and total time | optimization impact |
Report both total duration and launch count. A 10% family made of 2,000 tiny kernels suggests fusion or graph capture; a 10% family made of two long kernels suggests kernel-level work.
Quantify gaps
For a serial device interval,
This simple subtraction is invalid when streams overlap. In that case compute the union of occupied intervals, or use timeline recipes that account for concurrency.
The same accounting matters even when the launch count alone looks alarming. An observed graph-replayed training microstep in the case studies contained 4,948 internal kernel launches but only 0.16% device-idle time. The launch count looked alarming; the timeline showed that CPU dispatch was no longer the active limit.