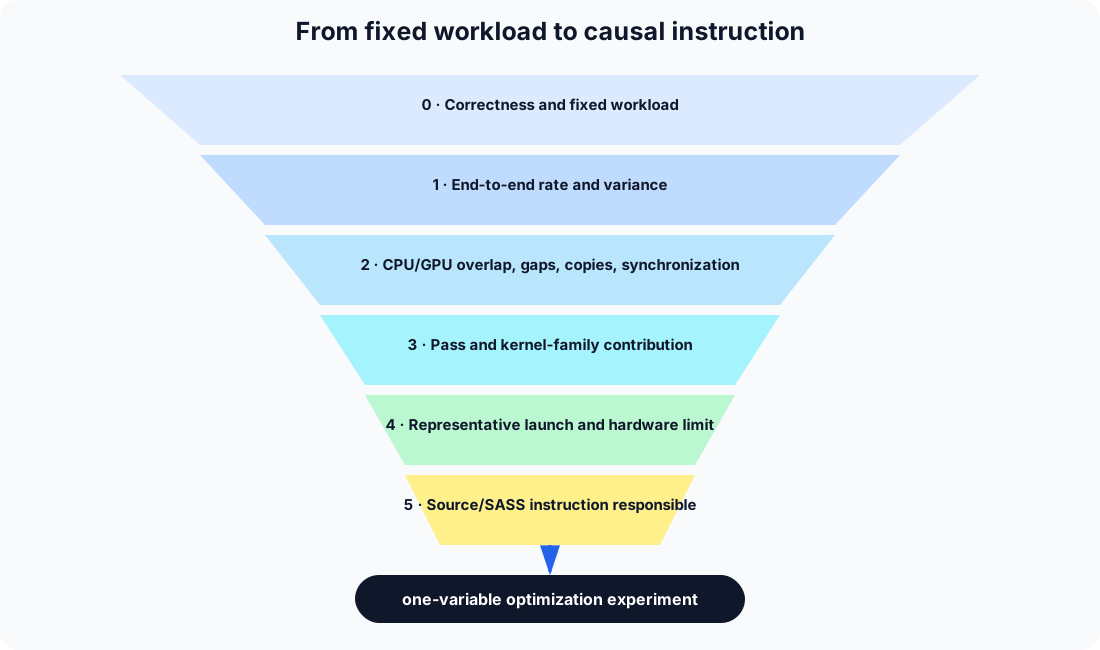
1. The profiling funnel
Treat performance analysis as a sequence of gates. Do not move down a level until the current level identifies a question that the next tool can answer.
The optimization ceiling
Total runtime is the sum of every region's time, so no matter how much a chosen region is accelerated, everything outside it is an unmovable floor — this is why the chapter insists on estimating the ceiling before investing effort. If a region occupies fraction of runtime and is accelerated by , Amdahl's law gives the end-to-end speedup
Even deleting a 3% kernel completely yields only . Use this calculation before spending an afternoon on a visually dramatic counter. The ceiling is unforgiving at small shares and only becomes worth chasing once a region dominates the total:
| Share of time | 2x region speedup | Region removed entirely |
|---|---|---|
| 1% | 1.005x | 1.010x |
| 5% | 1.026x | 1.053x |
| 20% | 1.111x | 1.250x |
| 50% | 1.333x | 2.000x |
Decide which branch to follow
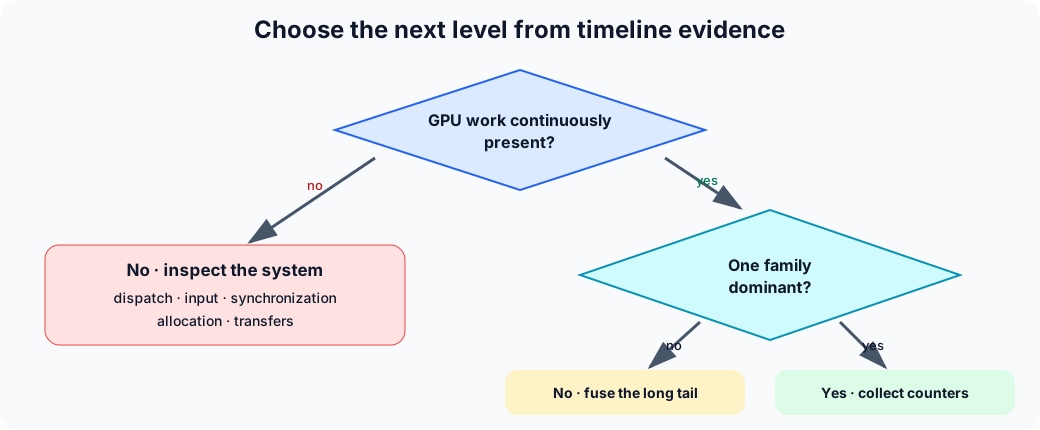
An iteration with thousands of kernels but less than 1% device idle time is not currently launch-starved. Graph capture (CUDA Graphs, covered in ch. 3) may have solved dispatch even though the graph still replays thousands of internal nodes. Keep host API duration and actual GPU idle gaps conceptually separate.
Evidence hierarchy
Prefer evidence in this order:
- repeatable end-to-end change;
- timeline change that accounts for it;
- counter change consistent with the timeline;
- compiler or SASS change that explains the counter;
- an intuition about what the hardware “should” do.
The last item is useful for forming hypotheses, not for declaring victory. Evidence closer to the top of this list is ranked higher because it is harder to fool yourself with: profiler overhead and measurement noise can produce an effect that looks real in a narrow, high-perturbation tool but disappears at the level that actually matters — unprofiled wall time.